
CNIB is committed to being fully transparent in our accounting practices. Our Board of Directors provides governance and financial oversight, assisted by the Finance and Risk Management Committee.
Understanding How Your Support Makes a Difference
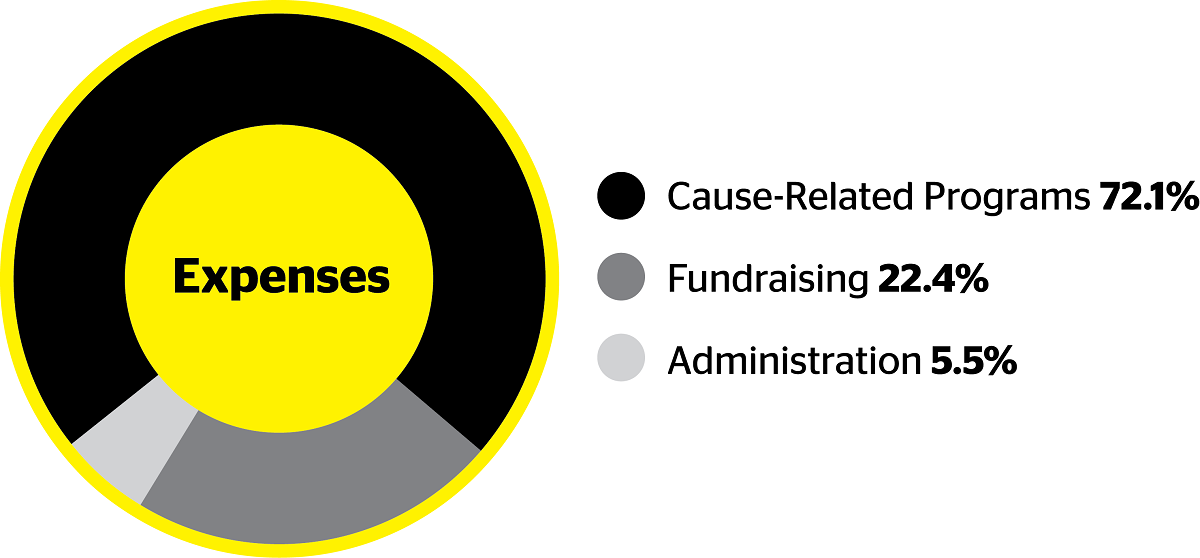
As a comprehensive view against total expenses, this pie chart demonstrates how CNIB invests in our community. The data is based on a five-year average of expenses (2020–2024) taken directly from CNIB’s audited financial statements, including programmatic expenses of CNIB and our related, affiliated organizations. To learn more, please see our Audited Financial Statements or explore our cause-related programs.
At CNIB, every dollar you give helps empower Canadians who are blind, Deafblind, or have low vision from coast to coast to coast. Here’s how your donation makes a difference:
Your Dollars at Work
$3.23 raised for every dollar spent – a 31% fundraising ratio
We strive to maximize your contributions to deliver life-changing programs for Canadians who are blind, Deafblind, or have low vision. Our impact is primarily powered by the generosity of Canadians from coast to coast to coast. CNIB donors help ensure we have the resources to follow through on our mission and empower those we serve to achieve their goals.
At CNIB, your dollars matter. To that end, as of June 2025, we are proud to share a fundraising ratio of 31% expenses to revenue. And we are equally pleased to report that we are able to raise $3.23 for every $1 spent.
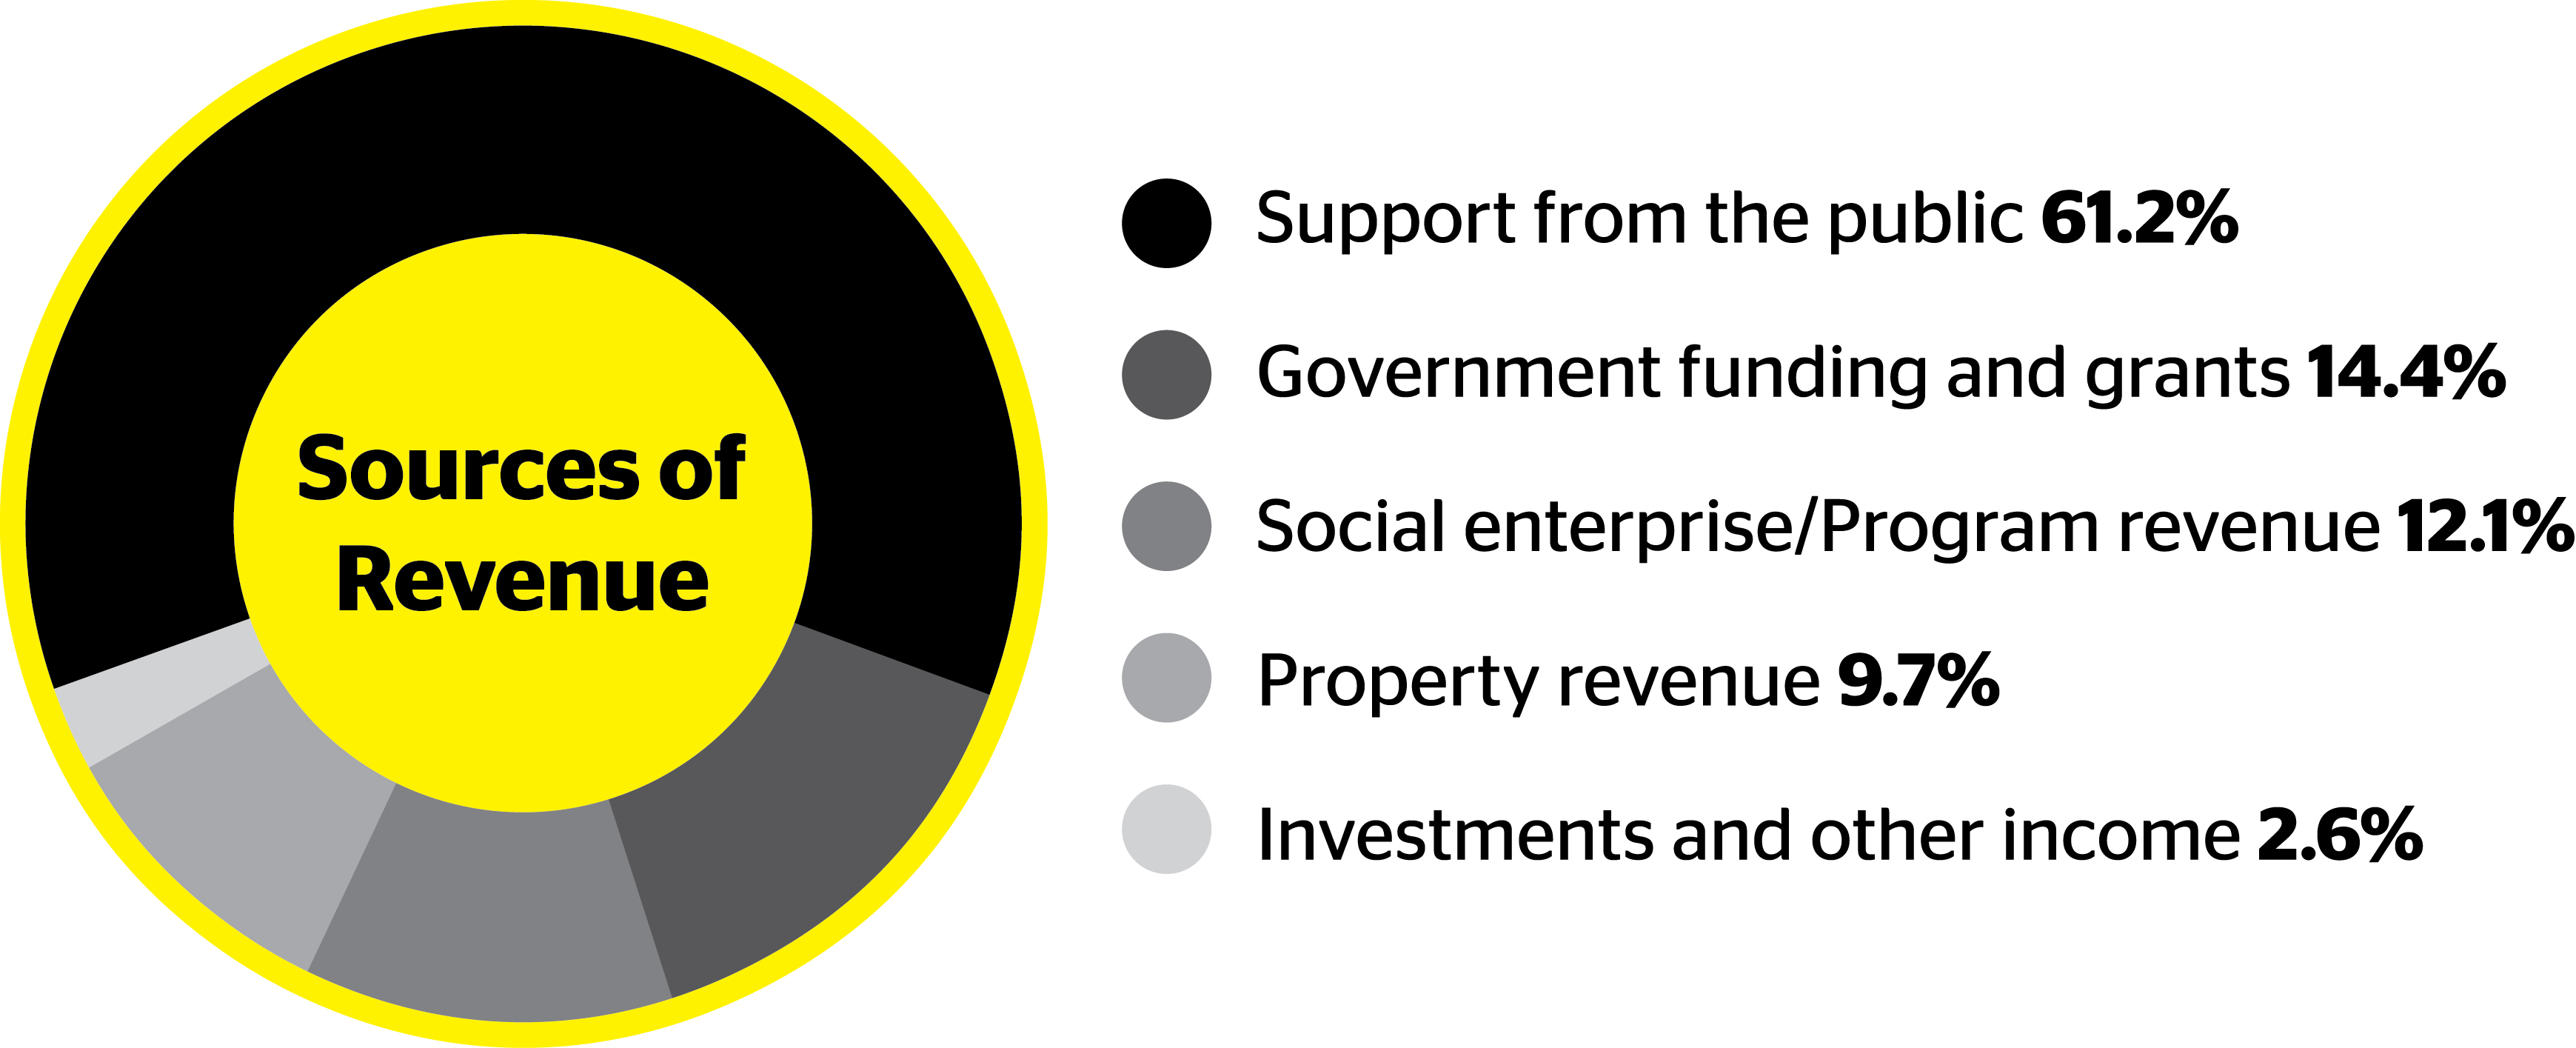
Sources of Revenue
Where did our fiscal year 2024–2025 support come from?
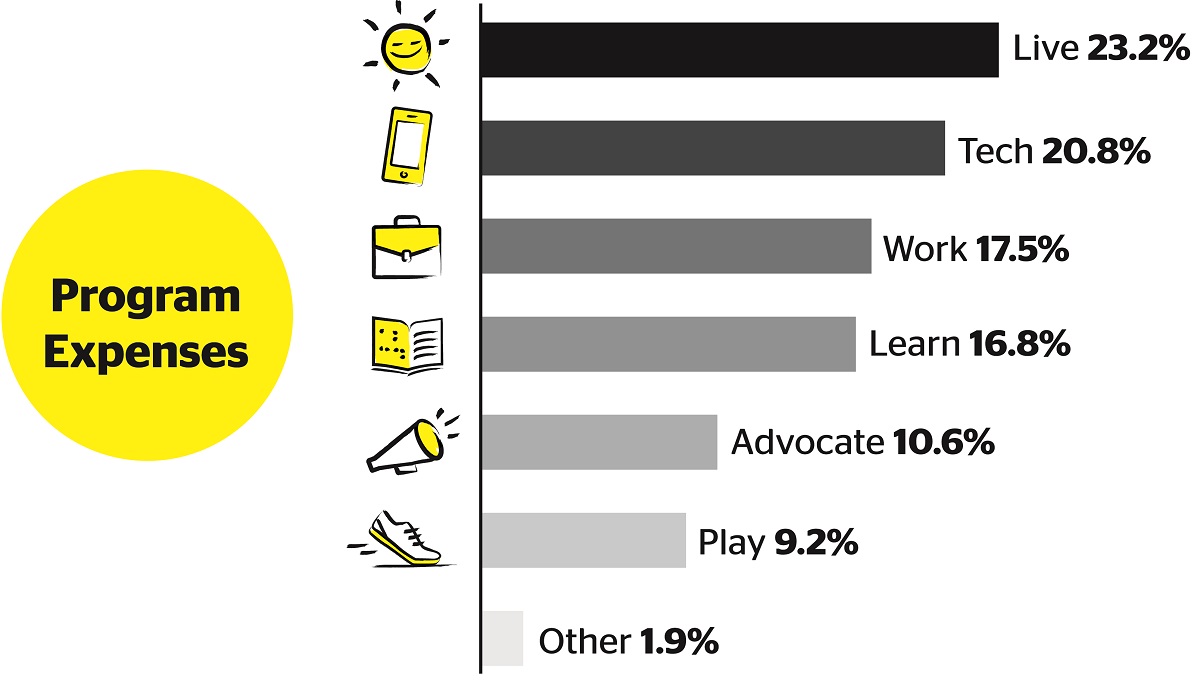
Program Expenses
Percentage of programmatic investments into our essential programs, services, and advocacy in fiscal year 2024–2025.
Charity Return
Financial Statements
Our full financial statements are audited annually by Ernst & Young LLP.
- 2024/2025 Audited Financial Statements (PDF)
- 2023/2024 Audited Financial Statements (PDF)
- 2022/2023 Audited Financial Statements (PDF)
- 2021/2022 Audited Financial Statements (PDF)
- 2020/2021 Audited Financial Statements (PDF)
- 2019/2020 Audited Financial Statements (PDF)
- 2018/2019 Audited Financial Statements (PDF)
- 2017/2018 Audited Financial Statements (PDF)
- 2016/2017 Audited Financial Statements (PDF)
- 2015/2016 Audited Financial Statements (PDF)
- 2014/2015 Audited Financial Statements (PDF)
- 2013/2014 Audited Financial Statements (PDF)